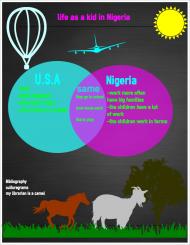
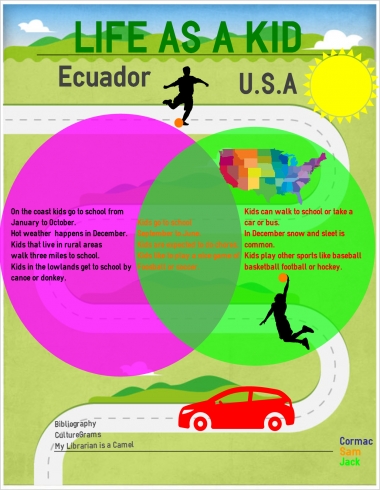
Fourth graders finished up and presented their
Easel.ly infographics which compared life as a kid in the United States with life as a kid in another country. Students gathered their information from
CultureGrams, filled in a Venn diagram graphic organizer, and then transferred the information to Easel.ly to create an online infographic. See below for some examples.
 easel.ly
 easel.ly
 easel.ly
No comments:
Post a Comment